Using the Analyses Window
The Analyses window is where you view the output files, output folders, and status of your analyses. You also can view the parameters you used when you submitted the analysis, relaunch an analysis with the same settings or alter them as desired, cancel an executing analysis, and delete an analysis file or folder. You also can share analysis results with collaborators, rename an analysis, and add or edit comments about the analysis.
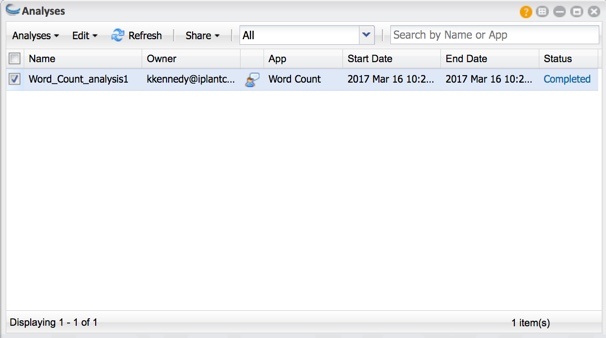
Viewing the status of your analysis and getting help
After launching your analysis, its status is displayed in the Analyses window in the Status column. If you think something may be wrong with the job—maybe it hasn’t progressed past Submitted or your analysis completed but you didn’t receive any output files—click the status link to get help. Depending on the current status, you will view possible issues and the opportunity to get help, all within the DE window.
For example, if your status has been in the Submitted state for a long time, click Submitted to view possible reasons why it has not progressed:

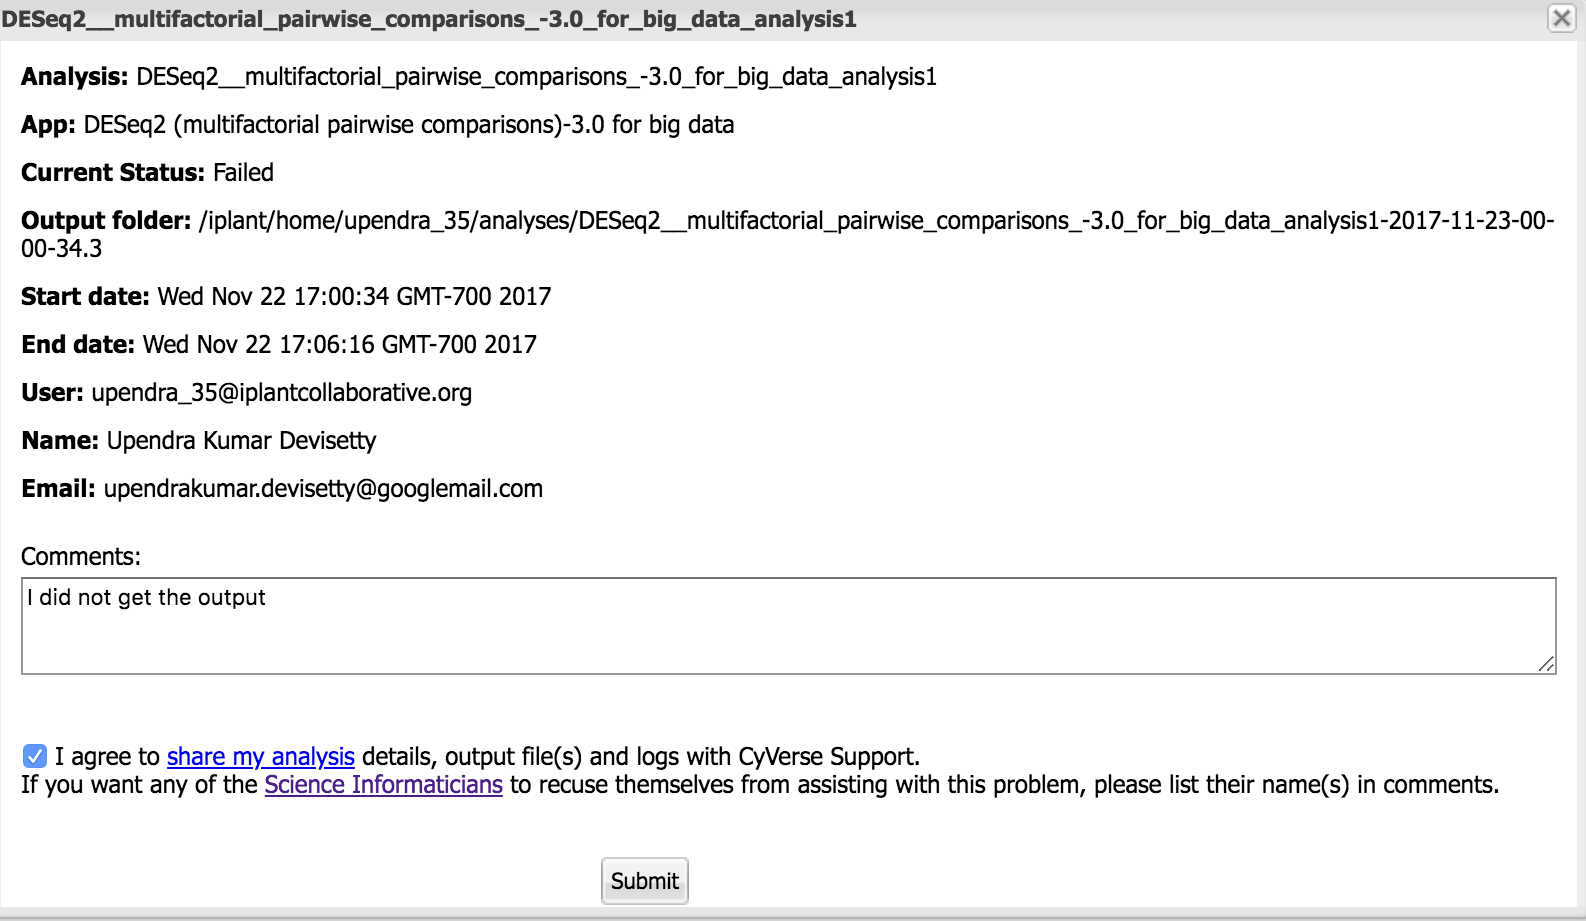
Read the help info shown, and after waiting the recommended 24 hours, click I still need help, enter details in the Comments field, click the checkbox to agree, and click Submit.
If the status of your analysis is failed, click Failed to view possible reasons why it is failed:
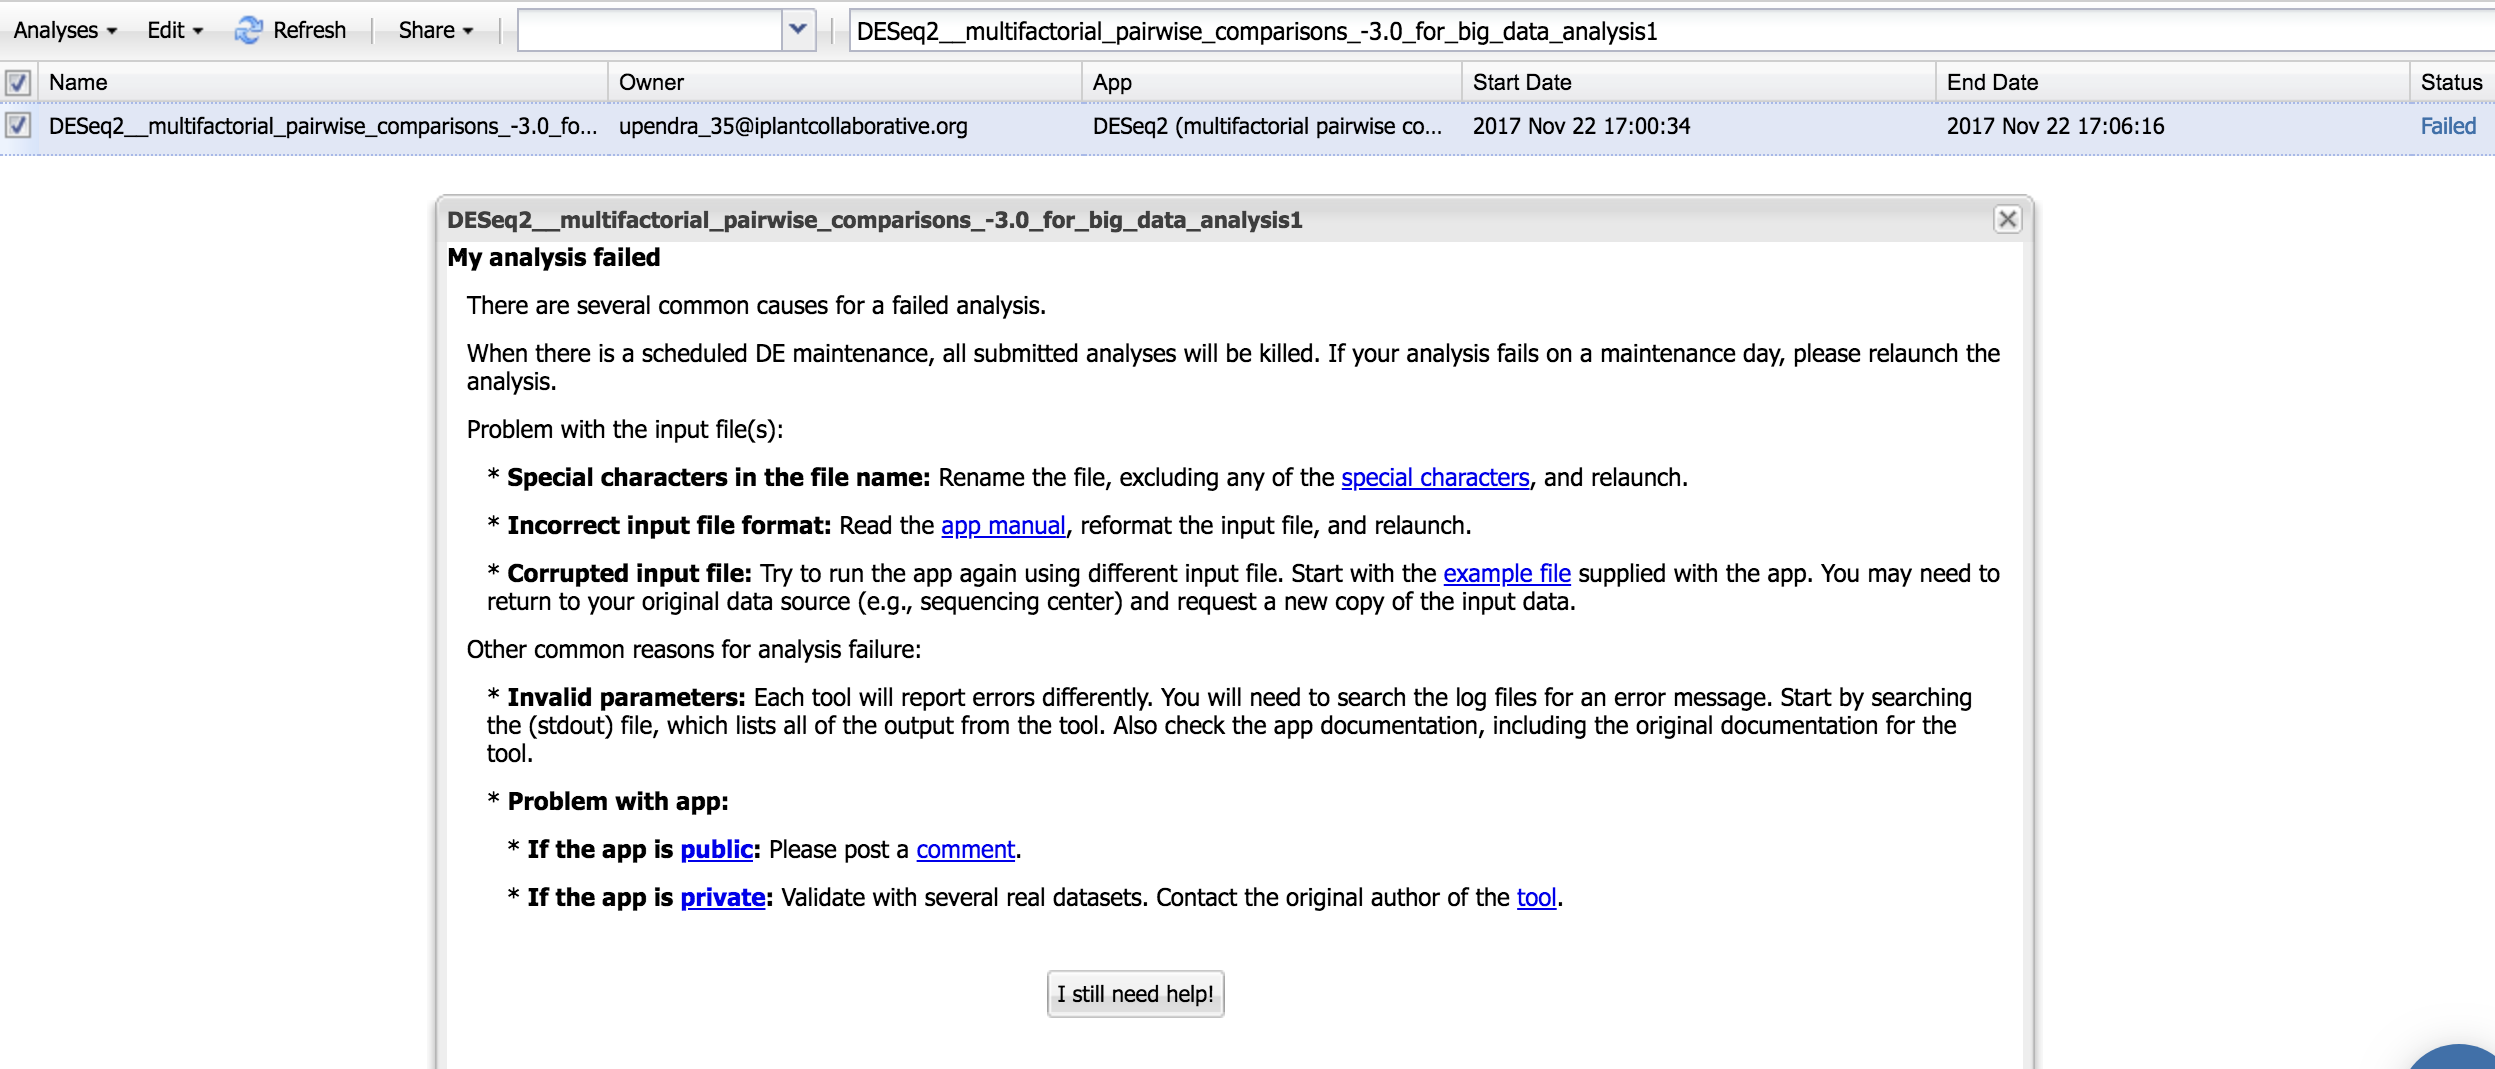
Read the help info shown and if that doesn’t help you troubleshoot, click I still need help, enter details in the Comments field, click the checkbox to agree, and click Submit.
Window icons
At the top right of each data, apps, or analyses window are icons to help you learn more about the DE, and manage the window’s size and display.
| Help: Click to open the FAQs page for the current window. | |
| Layout: Resizes the window layout to half of the available available desktop space and positions it either to the left (Snap Left) or right side (Snap Right) of the window. | |
| Minimize, Maximize, or close the active window. |
Relaunching, Canceling, and Deleting Analyses, Viewing Analysis Outputs and Info
The Analyses menu contains the list of all submitted, running, completed, and failed analyses. You submit the analysis in the Apps window and view the outputs or manage your analyses in the Analyses window.
After an analysis is completed, you can view the outputs of the analysis, the parameters you used to run the analysis, and different log files that provide useful information about the results. You also can troubleshoot a failed analysis from the Analyses window, and view troubleshooting pointers.
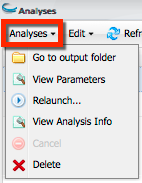
Viewing analysis output files (Go to output folder)
- In the Analyses window, find the analysis whose results you want to view with the status of Completed.
Tip
You may need to click ![]() or refresh your browser window.
or refresh your browser window.
- Click the checkbox next to the analysis name, click Analyses, and then click Go to output folder. You also can click the name in the Analyses list and view results in the Data window.
Viewing the parameters used for the analysis
After an analysis is completed, you can view the parameters you used to run the analysis. This is useful if you want to confirm or save the settings or files you used for the analysis. You also can view the outputs of the analysis and different log files, which provide useful information about the results.
- In the Analyses window, click the checkbox next to the completed analysis, click Analyses, and then click View Parameters.
- To save the parameters, click Save As, specify the file name and location, and click OK.
Viewing the status of an analysis and getting help
New for the 2.11 release is the ability to view more information about the status of an analysis that is taking a long time to complete or didn’t return the expected output files, and then request help within the DE.
- In the Analyses window, click the status of the analysis in the right column:
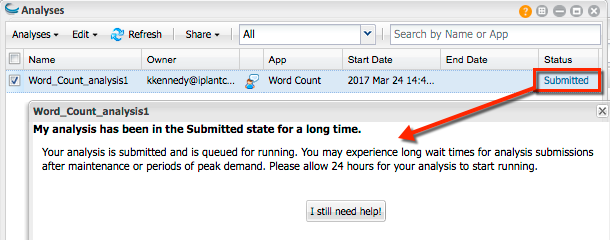
- View the Help text that is displayed (the current status defines what is displayed).
- If you still need help, click I still need help:
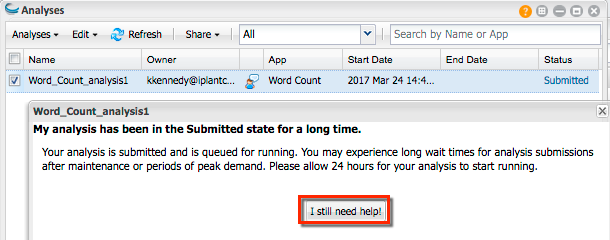
- Enter additional comments about the analysis, click the checkbox to agree to share your output files and details with Support staff, and click Submit. You will receive a response within 2 work days.
Relaunching an analysis with the same or different settings
You can relaunch an analysis with the same settings used in a previous analysis. This is useful if you want to change some but not all of the settings used for the previous analysis or just want to relaunch the same analysis with the same settings.
- In the Analysis window, click the name of the app in the App column for the analysis to rerun. A window opens with the same settings as used in the previous analysis.
- Change settings or inputs as needed.
- Click Launch Analyses,
Tip
You also can relaunch by clicking the checkbox for the analysis you want to relaunch, clicking the Analyses menu and then clicking Relaunch.
Viewing the Job ID and Type for an analysis
A useful tool for troubleshooting a failed Agave Analysis is sharing the job ID and job type with Support.
- In the Analysis window, click the checkbox for the analysis to relaunch.
- Click Analyses and then click View Analysis Info.
- To copy the Job ID, double-click on the ID and copy the string.
Canceling an executing analysis
You can cancel an analysis that is currently in a status of Submitted, Running, or Idle. This can be useful when an analysis has been running much longer than expected, or you simply want to cancel the analysis, make a change, and resubmit without having to wait for the analysis to complete.
- In the Analyses window, click the checkbox for the analysis that is in Submitted, Running, or Idle status.
- Click Analyses and then click Cancel.
- A popup is displayed in the bottom right corner that the analysis has been canceled, and your Notifications and Analyses lists show that the analysis failed.
If the analysis cannot be canceled, please email CyVerse Support with the analysis name so they can terminate the analysis.
Deleting analysis results
As an analysis proceeds, its status is displayed in the Analyses window and Notifications list. Once it has completed its execution, you can delete it.
- In the Analyses window, select the checkbox for the completed analysis to delete.
- Click Analyses and then click Delete.
- Click OK to the warning prompt.
You also can delete analysis results in the Data window by moving the results files to the trash.
Renaming an Analysis and Adding Comments (Edit menu)
Within the Edit menu in the Analyses window, you can rename an analysis and view, add, and edit comments about an analysis.

Renaming an analysis
You can rename an analysis that is in a status of Completed, Canceled, or Failed.
- In the Analyses window, click the analysis name you want to rename.
- Click Edit and then click Rename.
- Edit the name and click OK.
Updating comments about an analysis
You can add, edit, and view comments at any time.
In the Analyses window, find the analysis whose comments you want to add or update.
- Either:
Click
(Comments) next to the name of the analysis whose comments you want to view.
or
Click Edit and then click Update Comments.
In the Comments window, add, edit, or view the comments and click OK.
Sharing and Unsharing an Analysis
All analyses—both DE and Agave—now can be shared in any status within the DE beginning with the 2.11 release. When you do so, the output results files, input files, and parameters you used in the analysis are shared.
Note
About Sharing Permissions: When sharing an analysis that used an unpublished Agave app, it is important to understand that sharing permissions for Agave apps are different from sharing permissions for DE apps. Unless you are an Agave expert, we recommend that you set permissions for your unpublished Agave app within the DE rather than within Agave in order to avoid possible conflicts.
Opening the Select Collaborators window
- In the Analyses window, click the checkbox for the analysis to share.
- Click the Share menu and then click Share with collaborators.
- Click Choose Collaborators.
Sharing an analysis with a collaborator
- In the Select Collaborators window, either:
- Select an existing collaborator with whom you want to share the analysis by clicking a name in your list and then clicking OK. For information on creating and managing your collaborators list, see Adding and Deleting Users from the Collaborators List in Preferences. or
- Add and share the analysis with a new collaborator by clicking Manage Collaborators, entering the first few letters of the user to add, clicking the user, and then clicking OK.
Both the owner and the recipient receive notification that the analysis has been shared.
Unsharing an analysis with a collaborator
- In the Select Collaborators window for the analysis, click the user’s name for the sharing to revoke.
- Click
.
- Click Done.
Searching for an Analysis
You can filter (search) the list to find an analysis or app that was used in an analysis.
- In the Analyses window search field, enter at least 3 characters (case-insensitive) of the analysis or app used in the analysis.
- Within the search query, you can use the wildcards * (returns any character sequence) and ? (returns any single character sequence) to widen your search. You cannot start the query with a wildcard.
Analyses FAQs
These questions are also available within the DE. To view them there, open the Analyses window and then click ![]() . You can also view the Data FAQs within the Data window and the Apps FAQs within the Apps window.
. You can also view the Data FAQs within the Data window and the Apps FAQs within the Apps window.
- Why has my job failed or been running forever?
Troubleshooting a Failed Analysis will help you determine what went wrong and collect information for CyVerse staff in case you cannot resolve the problem yourself.
- How do I get help with a tool (app) or workflow?
The steps to get help depend on whether you’re a novice or an expert with the tool—executable or binary—on which the app or workflow is based.
Novice
Learn more about the tools used:
- Search the internet for the publication describing the tool and any related documentation.
- Make sure you understand what the tool is designed to do, what inputs it can accept and in which format, and how to set any parameters.
Search the internet for informative sites in your domain. For example, SEQanswers is the go-to online forum for the next-generation sequencing community.
Talk with someone at your institution who is more experienced with the tool.
Try to use the app in the Discovery Environment. Click
 next to the app name to view the app manual and its sample test input files and expected outputs.
Search Ask CyVerse for the answer. If it is not there, post a question.
Experienced with the tool or workflow
If you are experienced with the tool or workflow and need advice for how to work with very large-scale data or a complex workflow, you may request community support or Extended Collaborative Support.
Why is my analysis sitting in the Submitted state for so long?
Analyses that use an app that runs on an HPC system can remain in the Submitted state for hours or even days. They may sit in in the queue in Submitted state waiting to run, along with other possibly long-running jobs that were in the queue first. Therefore, it may take several days for your analysis to get its turn to run. Once your analysis runs, its results will be returned to the Data Store and the DE status will change to Completed. See Troubleshooting a Failed Analysis for more information on the different statuses and why an analysis might not complete.
- Is there a limit to how many analyses (jobs) I can run at the same time in the Discovery Environment?
Only 8 of your analyses will run at the same time. It’s fine to launch more, but they will not run until some of your analyses have completed.
- I’m trying to run an analysis, but when I enter an input I can’t see my files. Why? I know they are there.
Because the app requires a folder as input, not a file, the files don’t show since they aren’t the appropriate inputs for the app. The files are indeed there but don’t show. Check the app’s input box; if it says “Select a folder”, then it requires a folder input. Put the file(s) you want to input into a folder and then use that folder as input. Note: You can use Drag and Drop to input the folder by finding it in the Data window, making sure the folder name is shown in the center panel, and then dragging the folder into the app’s input box.
- How do I rerun a job I previously ran in the DE, but change some parameters or use a different input?
You can easily relaunch the same analysis with different settings:
- In the Analyses window, click the app name in the App column for the analysis to rerun. This opens up an app window for that app, which is already configured with the inputs and settings you used for the previous analysis run.
- Change settings or inputs as needed.
- Click Launch Analysis to launch the new analysis.
- How do I run the same analysis on a number of files most efficiently?
You can create a file that contains a list of up to 16 files to use as input for high-throughput and batch file execution. Such a file is called an HT Analysis Path List file. Learn more here, and if you still have questions, read here.
- I have a series of files that need to be analyzed by the same app, but the output files all have the same name. How do I distinguish them so I can use them in a workflow?
You can avoid confusion by:
- Find the output folder in your Data list,
- Rename each output file with a unique name.
- Use the files together in a step of the analysis workflow.
Troubleshooting an Analysis
It can be confusing to figure out why an analysis failed or doesn’t complete, because there are any number of reasons why this might happen. It could be that one of your input files is corrupted, wasn’t fully uploaded to the DE, or is in the wrong format. Maybe the problem is with the analysis name. Or maybe there’s a technical problem with the binary tool used for the app or with the Discovery Environment itself.
This page gives some tips on how to troubleshoot the problem so you can figure out whether it’s a problem with your file or with the Discovery Environment, and then help you either work on getting the problem fixed or resubmitting another analysis. See Analyses FAQs (above) as well.
Troubleshooting a failed or stalled analysis
If you know that an analysis typically completes in 20 minutes but you have one that still shows Running status 24 hours after you submitted it, if you didn’t get any output files or the output files were not what you expected, there could be a problem with your input files, the parameters you used, or there could be a problem with the app.
For more information on analyses status help, see Using the Analyses Window - Viewing the status of your analysis and getting help (above).
1. Read the tool’s documentation
CyVerse hosts hundreds of apps, and our staff are not experts on most of them. The best way to find out how an app should work is by reading the original documentation that came with the tool. You can access the documentation for an app by clicking on the “i” button next to the app name (see Viewing App and Tool Information). This will take you either directly to the tool documentation or to a wiki page that links out to the tool documentation. You should always understand how an app works before you use it to analyze data.
2. Check the log files
One of the main tools available for troubleshooting a failed analysis is the set of log files that are returned with each completed or failed analysis. These log files contain important information about the analysis, such as the settings that were used, files you used, and, in the case of a failed analysis, information to help explain why the analysis failed.
Because different apps are based on different tools, there is no standard method used for error reporting, so the same type of error may land in different log files. For example, one app may return errors to the stdout files (usually the screen, although it can be redirected and is generally captured in a log file here), while another saves its errors to the stderr files (which usually writes to a file, but can also be redirected). This means you may well have to look in more than one log file when troubleshooting a failed analysis.
The log files that most commonly contain error information are (numerals in the filename correspond to the step number that was logged in your analysis):
- condor-stderr and condor-input-stdout log files contain errors and details about Condor, the batch manager program that handles the execution of your analyses submission in the analyses queue.
- condor-input-stderr and condor-input-stdout files contain details about outputs from the tool upon which the app is based.
If there was a problem with your input files or parameters, this will often be reported in the condor-stderr file.
See About Log Files for a more complete description of the contents of the files that are returned, as well as useful tips for app integrators.
3. Check the input files and parameter
View the parameters to make sure you used the correct input files and settings
4. Did CyVerse go into maintenance?
If you had a long-running analysis that failed, make sure that CyVerse did not enter maintenance while it was running. Check the maintenance calendar.
If your job was interrupted by maintenance, you can relaunch the analysis using the same files and settings.
5. Check is the app is functioning properly
If you suspect that the app is not working correctly, try to run it with the example data. Most apps have a quickstart that lists example data in the List of Applications. You can also get to the quickstart by viewing the app info by clicking on the “i” button.
Requesting additional help
Please go through all the troubleshooting steps yourself before requesting help. The problem is often something that you can diagnose yourself.
If you still need help, you can submit a request for help directly in the Analyses window. The status of the analysis determines the Help information that is displayed.
- In the Analyses window, find the analysis with the possible issue. Click the status (i.e. ‘Failed’) of the failed analysis whose outputs you want to view.
- Review the troubleshooting suggestions above.
- If you still need assistance, click I still need help and complete the form.
Getting additional help
View the CyVerse maintenance calendar for upcoming and current maintenance periods. You also can see the Status page on the CyVerse website and the most recent CyVerse *Node* newsletter (which lists the upcoming maintenance periods). Other helpful sources are the CyVerse Facebook page, CyVerse Tweets, or the CyVerse Google+ page, and within the DE you may receive system messages as well.
About Log Files
About the Logs directory
The logs directory is created as a subdirectory in every analysis results directory. It contains several log files that may be useful for troubleshooting when problems occur. They also are extremely useful to the people in CyVerse Support as well as those who created the new app interface. This page contains a description of each log file. Note that not all log files are returned for every analysis.
The Job Execution Framework (JEX) treats single-app analyses as a workflow in which only a single app is executed as part of the analysis; hence the files are numbered even when a single tool is being executed. In reality, all analyses are workflows since the JEX adds executions of administrative tools to every analysis execution. The numbers in the log file names (as in condor-0-input-0-stderr) correspond to the number of the step in your analysis; in a single-app analysis, the number is always 0.
Note
Files that contain err and stdout in the name are available in several log files, and one or more may contain useful error and warning messages. One effective troubleshooting technique is to examine all err and stdout files that have a nonzero size.
Renamed Condor files
The files that follow the naming convention condor-0-input-0-stderr and condor-0-input-0-stdout have been renamed to follow this convention: logs-stdout-input-0 or logs-stdout-input-0. This was done because those log files are no longer generated by condor and to make the filenames more easily sorted. The content in the files may has been changed in format, but they still contain the output of the file transfer steps.
The files that follow the naming convention of condor-stderr-0 and condor-stdout-0 have not been changed.
- logs-stdout-input-0 (renamed from condor-0-input-0-stderr): stderr output from the first input file transfer of the first app in the workflow.
- logs-stdout-input-0 (renamed from condor-0-input-0-stdout): stdout output from the first input file transfer of the first app in the workflow.
- condor-stderr-0: stderr output from the execution of the analysis for the first app in the workflow.
- condor-stdout-0: stdout output from the execution of the analysis for the first app in the workflow.
Removed files
- imkdir log files: The imkdir log files, imkdir-stderr and imkdir-stdout, are no longer returned. The creation of the output directory is now performed by the tool that does the uploads of the output files, so these logs are no longer created.
- iPlant log files: The iPlant log files, iplant.cmd and iplant.sh, are no longer returned. We no longer generate an iplant.sh file for each job, and the iplant.cmd file is a templated file that barely changes between jobs. The logic for running the applications is now handled by a tool written specifically for that job, so we no longer have to generate bash scripts. The new JobSummary.csv file (see below) roughly corresponds to the useful information that was contained in the iplant.cmd file before it was eliminated.
- Output log files: The output log files, output-last-stderr and output-last-stdout, are no longer returned. There was a nasty race condition where the the tool that performs file transfers would sometimes try to upload these files while they were still being written to by the same uploader tool, resulting in a crash and job failures.
- Script log files: The script log files, script-condor-log, script-error.log, and script-output.log, are no longer returned. They were created by HTCondor in the submission directory on our submission node in an NFS mount shared across all of our compute nodes. The NFS mount was/is a single point of failure that could cause all jobs running in the cluster to fail at the same time, so we’ve been moving everything off of it. Unfortunately, this means that the script log files are now only available on the submission node (since that’s where HTCondor creates them) and we haven’t yet found a good way of transferring the files into iRODS without turning the submission node into a significant performance bottleneck.
New files
- JobSummary.csv contains a summary of the job as a CSV file. This roughly corresponds to the useful information that was contained in the iplant.cmd file before it was eliminated.
- JobParameters.csv contains the command-line flags used to invoke the tools used in the app. This can be used to figure out what flags were passed to a tool, what order they were passed in, and how they were parsed by the system.
Fix or improve this documentation
- Search for an answer: CyVerse Learning Center
- Ask us for help:
click
 on the lower right-hand side of the page
 - Report an issue or submit a change: Github Repo Link
- Send feedback: Tutorials@CyVerse.org
- Live chat/help: Click on the
 on the bottom-right of the page for questions on documentation
